How good monitoring saved our ass ... again
You know how it goes - suddenly people complain your app does not work, your are getting plenty of timeouts or other errors in your error tracking tool, you find the backend app that is misbehaving and finally "fix" the problem by restarting it. Phew!
But why? What caused the downtime? A glitch an an upstream system? Sudden overload due to a spike in concurrent users? Trolls?
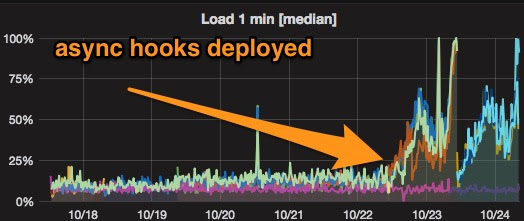
You know that it helps sometimes to zoom out, to get the right perspective. Here the perspective was 7 days:

It was enough to look at this chart with the right zoom to see at once that something happened on October 23rd that caused a significant change in the behavior of the application. Quick search and indeed, the change in CPU usage corresponds with a deployment. A quick revert to the previous version shortly confirmed the culprit. (It would have been even easier if we showed deployments on these charts.)
This is not the first time good monitoring saved us. A while ago we struggled regularly with the application becoming sluggish and had to restart it regularly. A graph of the Node.js even loop lag showed it increasing over time. Once it was on the same dashboard as Node's heap usage, we could at once see that it correlated with increasing memory usage - indicating a memory leak. Few hours of experimenting and heap dump analysis later the problem was fixed.
So good monitoring is paramount.
Of course the trick is to know what to monitor and to display all relevant metrics in such a way that you can spot important relations. I am still working on improving that...
But why? What caused the downtime? A glitch an an upstream system? Sudden overload due to a spike in concurrent users? Trolls?
You know that it helps sometimes to zoom out, to get the right perspective. Here the perspective was 7 days:
It was enough to look at this chart with the right zoom to see at once that something happened on October 23rd that caused a significant change in the behavior of the application. Quick search and indeed, the change in CPU usage corresponds with a deployment. A quick revert to the previous version shortly confirmed the culprit. (It would have been even easier if we showed deployments on these charts.)
This is not the first time good monitoring saved us. A while ago we struggled regularly with the application becoming sluggish and had to restart it regularly. A graph of the Node.js even loop lag showed it increasing over time. Once it was on the same dashboard as Node's heap usage, we could at once see that it correlated with increasing memory usage - indicating a memory leak. Few hours of experimenting and heap dump analysis later the problem was fixed.
So good monitoring is paramount.
Of course the trick is to know what to monitor and to display all relevant metrics in such a way that you can spot important relations. I am still working on improving that...