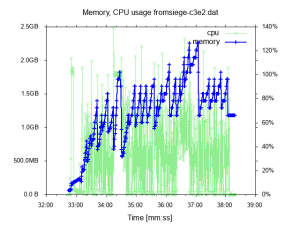
Monitoring process memory/CPU usage with top and plotting it with gnuplot
If you want to monitor the memory and CPU usage of a particular Linux process for a few minutes, perhaps during a performance test, you can capture the data with
top and plot them with gnuplot. Here is how:Run this script (perhaps via
nohup) to capture the data:| #!/bin/sh | |
| # Usage: ./monitor-usage.sh <PID of the process> | |
| # Output: top.dat with lines such as `1539689171 305m 2.0`, i.e. unix time - memory with m/g suffix - CPU load in % | |
| # To plot the output, see https://gist.github.com/jakubholynet/931a3441982c833f5f8fcdcf54d05c91 | |
| export PID=$1 | |
| rm top.dat | |
| while true; do top -p $PID -bMn 1 | egrep '^ *[0-9]+' | awk -v now=$(date +%s.%N) '{print now,$6,$9}' >> top.dat; done |
then plot them via
./usage-plot.gp top.dat top.png:| #!/usr/bin/env gnuplot --persist -c | |
| # Plot memory and CPU usage over time. Usage: | |
| # usage-plot.gp <input file> [<output .png file>] | |
| # where the input file has the columns `<unix time> <memory, with m/g suffix> <% cpu>` | |
| # To create the input file, see https://gist.github.com/jakubholynet/931a3441982c833f5f8fcdcf54d05c91 | |
| # Arguments: | |
| infile=ARG1 | |
| outfile=ARG2 | |
| set term x11 | |
| set title 'Memory, CPU usage from' . infile | |
| set xdata time | |
| set timefmt "%s" | |
| set xlabel "Time [[hh:]mm:ss]" | |
| set ylabel "Memory usage" | |
| set format y '%.1s%cB' | |
| set y2label 'CPU usage' | |
| set format y2 '%.0s%%' | |
| set y2tics nomirror | |
| set tics out | |
| set autoscale y | |
| set autoscale y2 | |
| # Credit: Christoph @ https://stackoverflow.com/a/52822256/204205 | |
| resolveUnit(s)=(pos=strstrt("kmgtp",s[strlen(s):*]), real(s)*(1024**pos)) | |
| if (exists("outfile") && strlen(outfile) > 0) { | |
| print "Outputting to the file ", outfile | |
| set term png # 640,480 | |
| set output outfile | |
| } | |
| # Styling | |
| set style line 1 linewidth 2 linecolor 'blue' | |
| set style line 2 linecolor 'light-green' | |
| #set xtics font ", 10" | |
| set tics font ", 10" | |
| set xtics rotate 60 # put label every 60s, make vertical so they don't clash in .png if too many | |
| plot infile u 1:3 with lp axes x1y2 title "cpu" linestyle 2, \ | |
| infile using 1:(resolveUnit(stringcolumn(2))) with linespoints title "memory" linestyle 1 |